
Case file
Performance marketing work a CFO will trust.
Published SpikeROAS results only: 3.91x Google Ads ROAS on $2.65M for a Florida hardware brand, Meta website leads from $3.35 for Tergar, Search Console 51.1 → 13.2 for a USA marketing agency, and Lightspares +649% gross sales. Healthcare, IVF, legal, and solar are capabilities until we publish them — see industries.
Shipped storefronts
Websites we built.
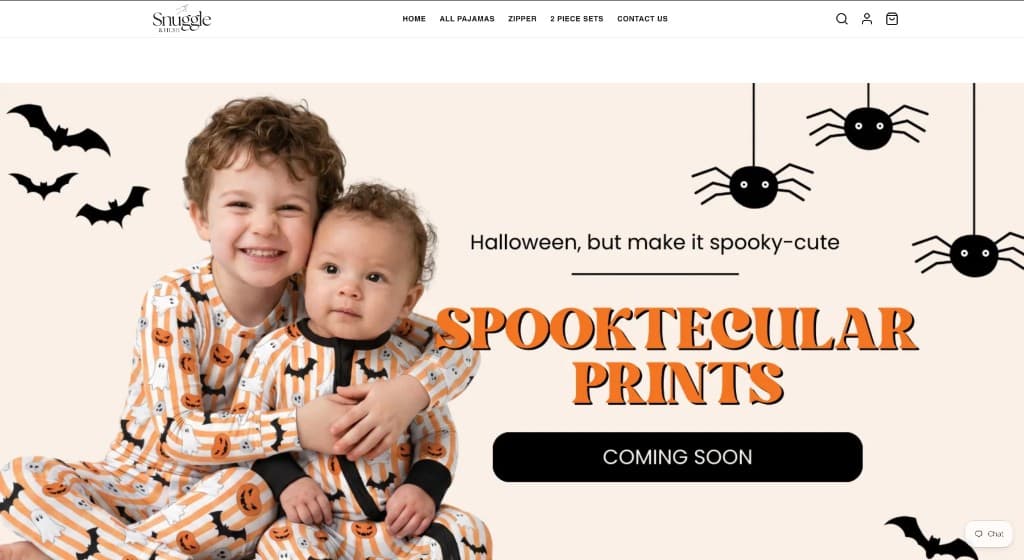
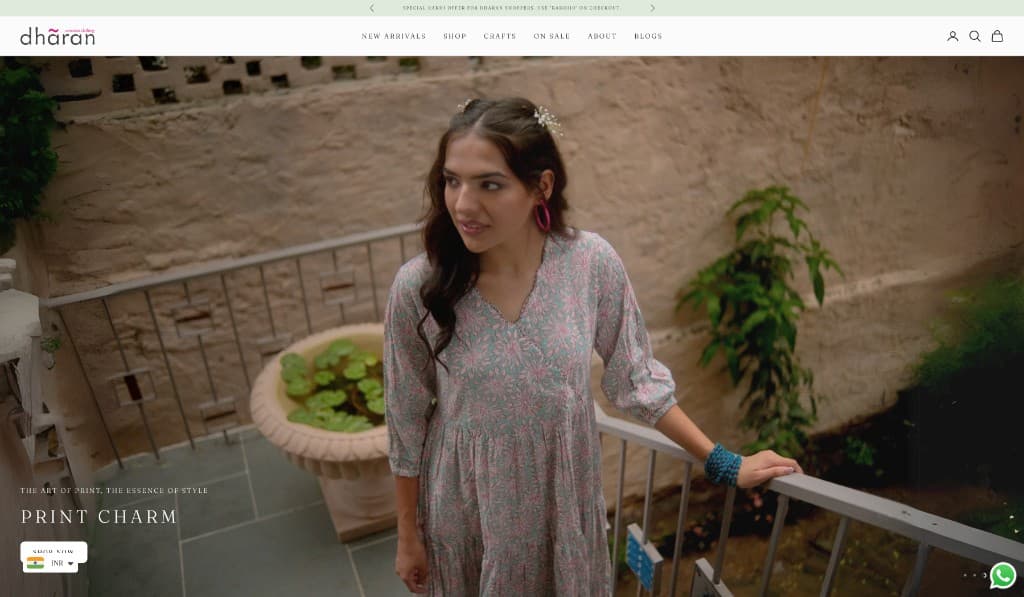
Live Shopify stores on this desk. Visit the site — the work is on the domain, not a mock.
Client result · United States
Organic SEO for a USA marketing agency.
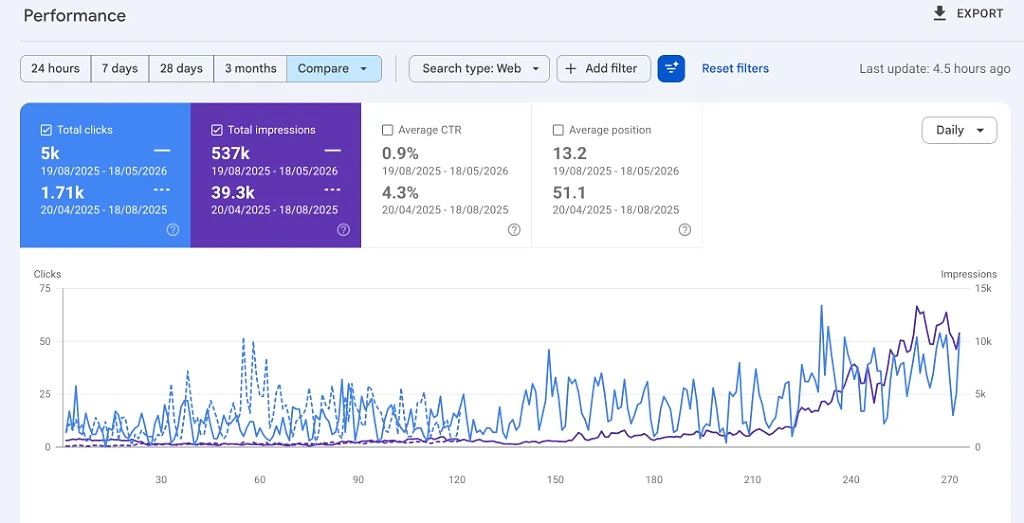
A USA marketing agency hired us as the organic desk. We rebuilt information architecture, shipped SEO content, and ran on-page SEO. Google Search Console (web, compare, 19 Aug 2025–18 May 2026 vs 20 Apr–18 Aug 2025): average position 51.1 → 13.2, impressions ~325 → ~1,967 per day, clicks ~14.1 → ~18.3 per day. The compared windows are different lengths (273 vs 121 days), so we report per-day figures rather than the raw totals.
- Organic information architecture and internal linking
- On-page SEO: titles, headings, entities, and conversion paths
- SEO content system — briefs, drafts, and money-page refreshes
Avg. position
13.2
from 51.1
Impressions / day
1,967
from 325
Clicks / day
18.3
from 14.1
Client result · Florida
Google Ads for a hardware brand.
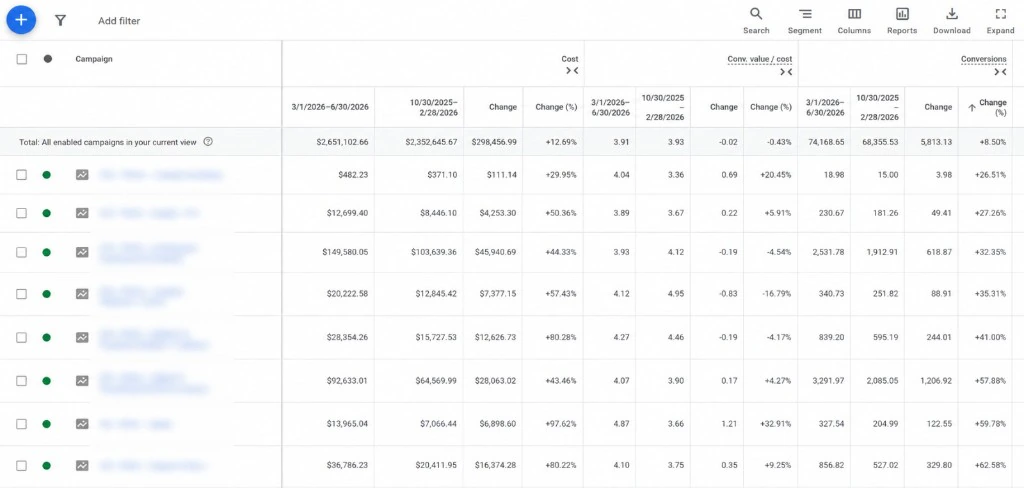
A Florida hardware brand needed Google to take more volume without breaking the unit. We rebuilt Shopping and search architecture, then scaled only where ROAS held. Mar–Jun 2026 vs the prior four months: $2.65M spend (+12.69%), 74,169 conversions (+8.50%), ROAS 3.91 vs 3.93. Catalog work on Meta still sits beside it — Google is the scale floor.
- Google Ads architecture — Shopping, search, and brand vs non-brand
- Scale rules: more budget only where ROAS held
- Feed and catalog hygiene so Shopping could take the volume
Google Ads ROAS
3.91x
held vs 3.93
Ad spend
$2.65M
+12.69%
Conversions
74,169
+8.50%
Client result · Minneapolis
Meta ads for Tergar.
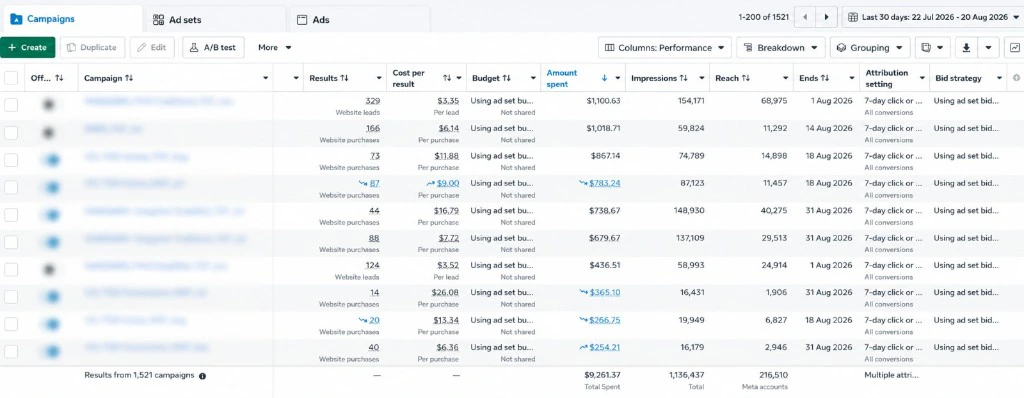
Traffic was steady. Sales were not. We tightened Meta audiences and creative, kept Google on high-intent search, and fixed the conversion path. Last 30 days in Ads Manager, across the highest-spending campaigns: website leads from $3.35 to $3.52, website purchases from $6.14 to $26.08, $9,261 spent, 216,510 reach. Across the program: +16% total sales, 502 orders (+9%), returning customer rate 45.68%.
- Meta structure split for website leads and website purchases — not one blended campaign
- Creative tests with a kill threshold; tired ads left the account
- Conversion-path and offer work so CPA could stay in range
Best lead CPA
$3.35
top campaign; range to $3.52
Best purchase CPA
$6.14
top campaign; range to $26.08
30-day spend
$9,261
1.14M impressions · 216.5k reach
04 · Ecommerce / Stage lighting
Lightspares
Europe
+649%
gross sales in 6 months
10x catalog ROAS · 4,532 orders
Meta CPA was too high to scale. Catalog ads brought ROAS to 10x. Google product feed and structure ran in parallel. Gross sales +649%, total sales +471%, 4,532 orders (+540%) with 4,001 fulfilled. Returning customer rate doubled to 10.31%.
Stack: Meta, Google Ads, catalog / product feed, and conversion work. Reported from the account, not a slide deck.
Want the unredacted version?
We walk relevant proofs on the Spike Brief. Industry-matched.